INDIGENOUS VISION (IV) Maps compiles public source data and works with communities to assess environmental contaminants and create custom maps that highlight cultural, environmental, and social data that allows the public and leaders to monitor events, make decisions, inform others, and see trends.
You can contribute to the model and be an author of map data! Get involved by submitting a report here. Join our Citizen Science Project by contacting us!
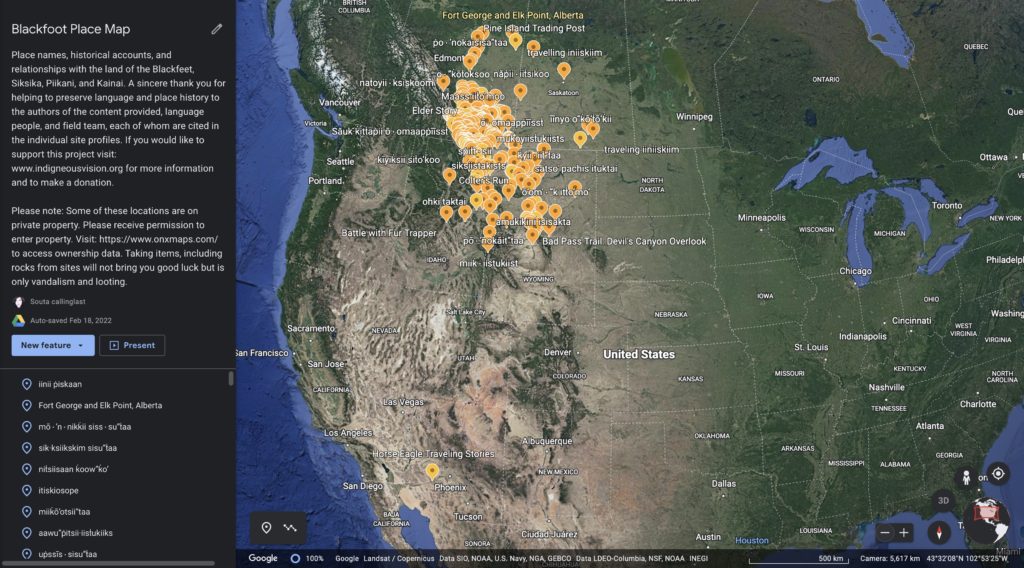
All the mapping projects of Indigenous Vision including the Blackfoot Place Map and the Cumulative Water Impact Map below are combined to give the model above. Some data couldn’t be found through public agencies so we had roll up our sleeves and collect the environmental data ourselves. Fortunately, IV didn’t have to do this work by ourselves. Our partners at Working Dogs for Conservation helped proof a new method in the Blackfeet Environmental Stressor, Disease and Contaminant Mapping Project to assess heavy metals within the food chain. Since incinerating macro invertebrates are culturally inappropriate for project lead Souta Calling Last, they helped use dogs (traditionally Blackfoot again!) to detect mink and otter scat. We sent the scat to various labs throughout Montana and Colorado and proofed the new, non-lethal, methodology. Dogs, TEK and Scat to find Pharmaceuticals, pesticides, heavy metals, and PFAS within the food chain was all proofed, included and approved by the EPA. All for the first time ever in EPA history.
We can see and learn about ancestral historical uses based on climate and animal migration patterns by understanding the strategic placement of tipi camp occupation, bison jump, piskun and drive line use. Many of these features can be carbon dated and for untouched rocks soil samples can be taken to give data sets that span up to 10,000 years ago.
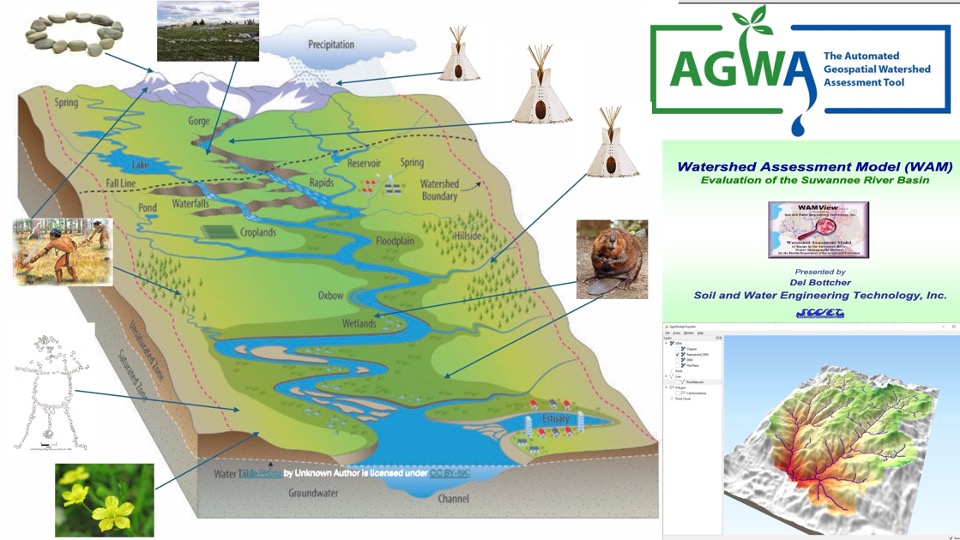
Understanding historical use will help lead us into the future. Not only could this model prevent catastrophic cultural clashes like that seen at Standing Rock but it can help manage habitats for bison revitalization and cultural practices to persist into future similar to to the practices held by ancestors.
North American Water Health: A map of cumulative impact.
If you are aware of industrial or manufacturing activity impacting water and do not see it on this map you can submit a report through our citizen science program and the link above.
Take your time to explore the map by toggling the different layers on and off. Explore where and how water is being cumulatively impacted and start to think about how you can help monitor and assist in a clean-up in your area! Every effort will make a big difference.
Indigenous People | Violence, Discrimination, MMIP Reports & Resources
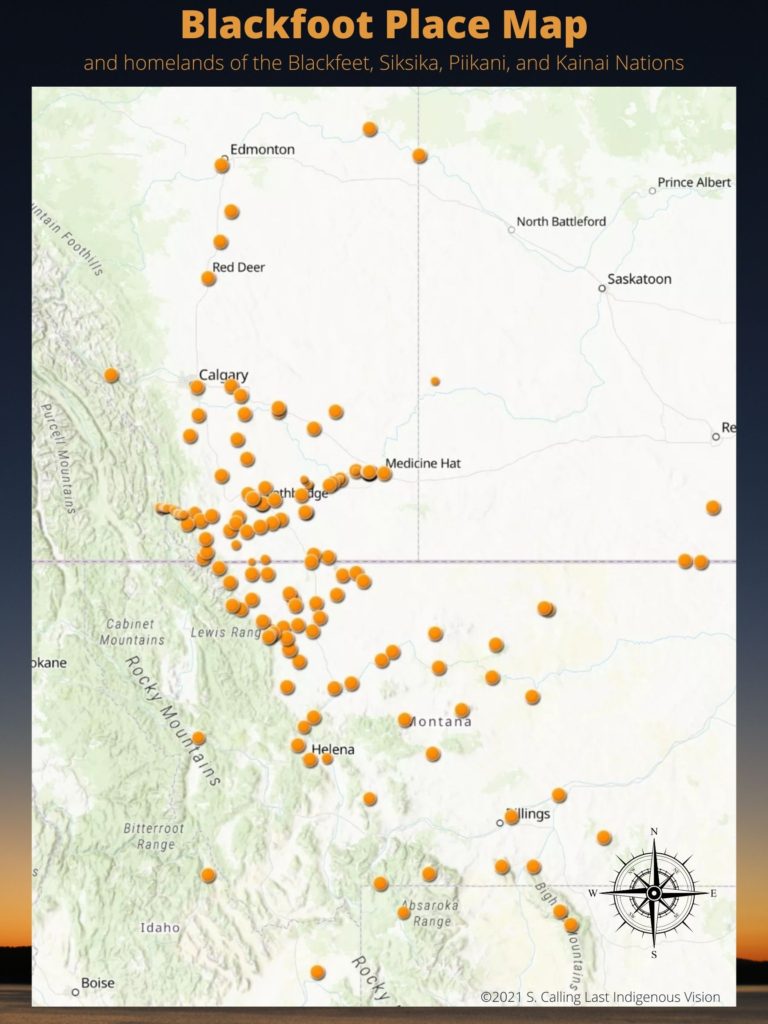
Check out other IV Maps:
IV in the news…
- 8 Female Entrepreneurs Who Are Changing the Travel Space (Published on November 20, 2021)
- First Nations woman creates tourism app showing Blackfoot lands across Canada (April 15, 2021)
IV Maps is community-supported and funded by grants, donations, fees for service, and made possible by citizen scientists and volunteers. The Roddenberry Foundation, NoVo Foundation, Tides Foundation, Solidaire Network, and Grantmakers For Girls of Color have all contributed support for capacity development and project implementation.
Please support Indigenous Geography by making a tax-deductible donation.